A Nutrition Website Roughly Quadrupled Its Daily Google AI Impressions in Three Months
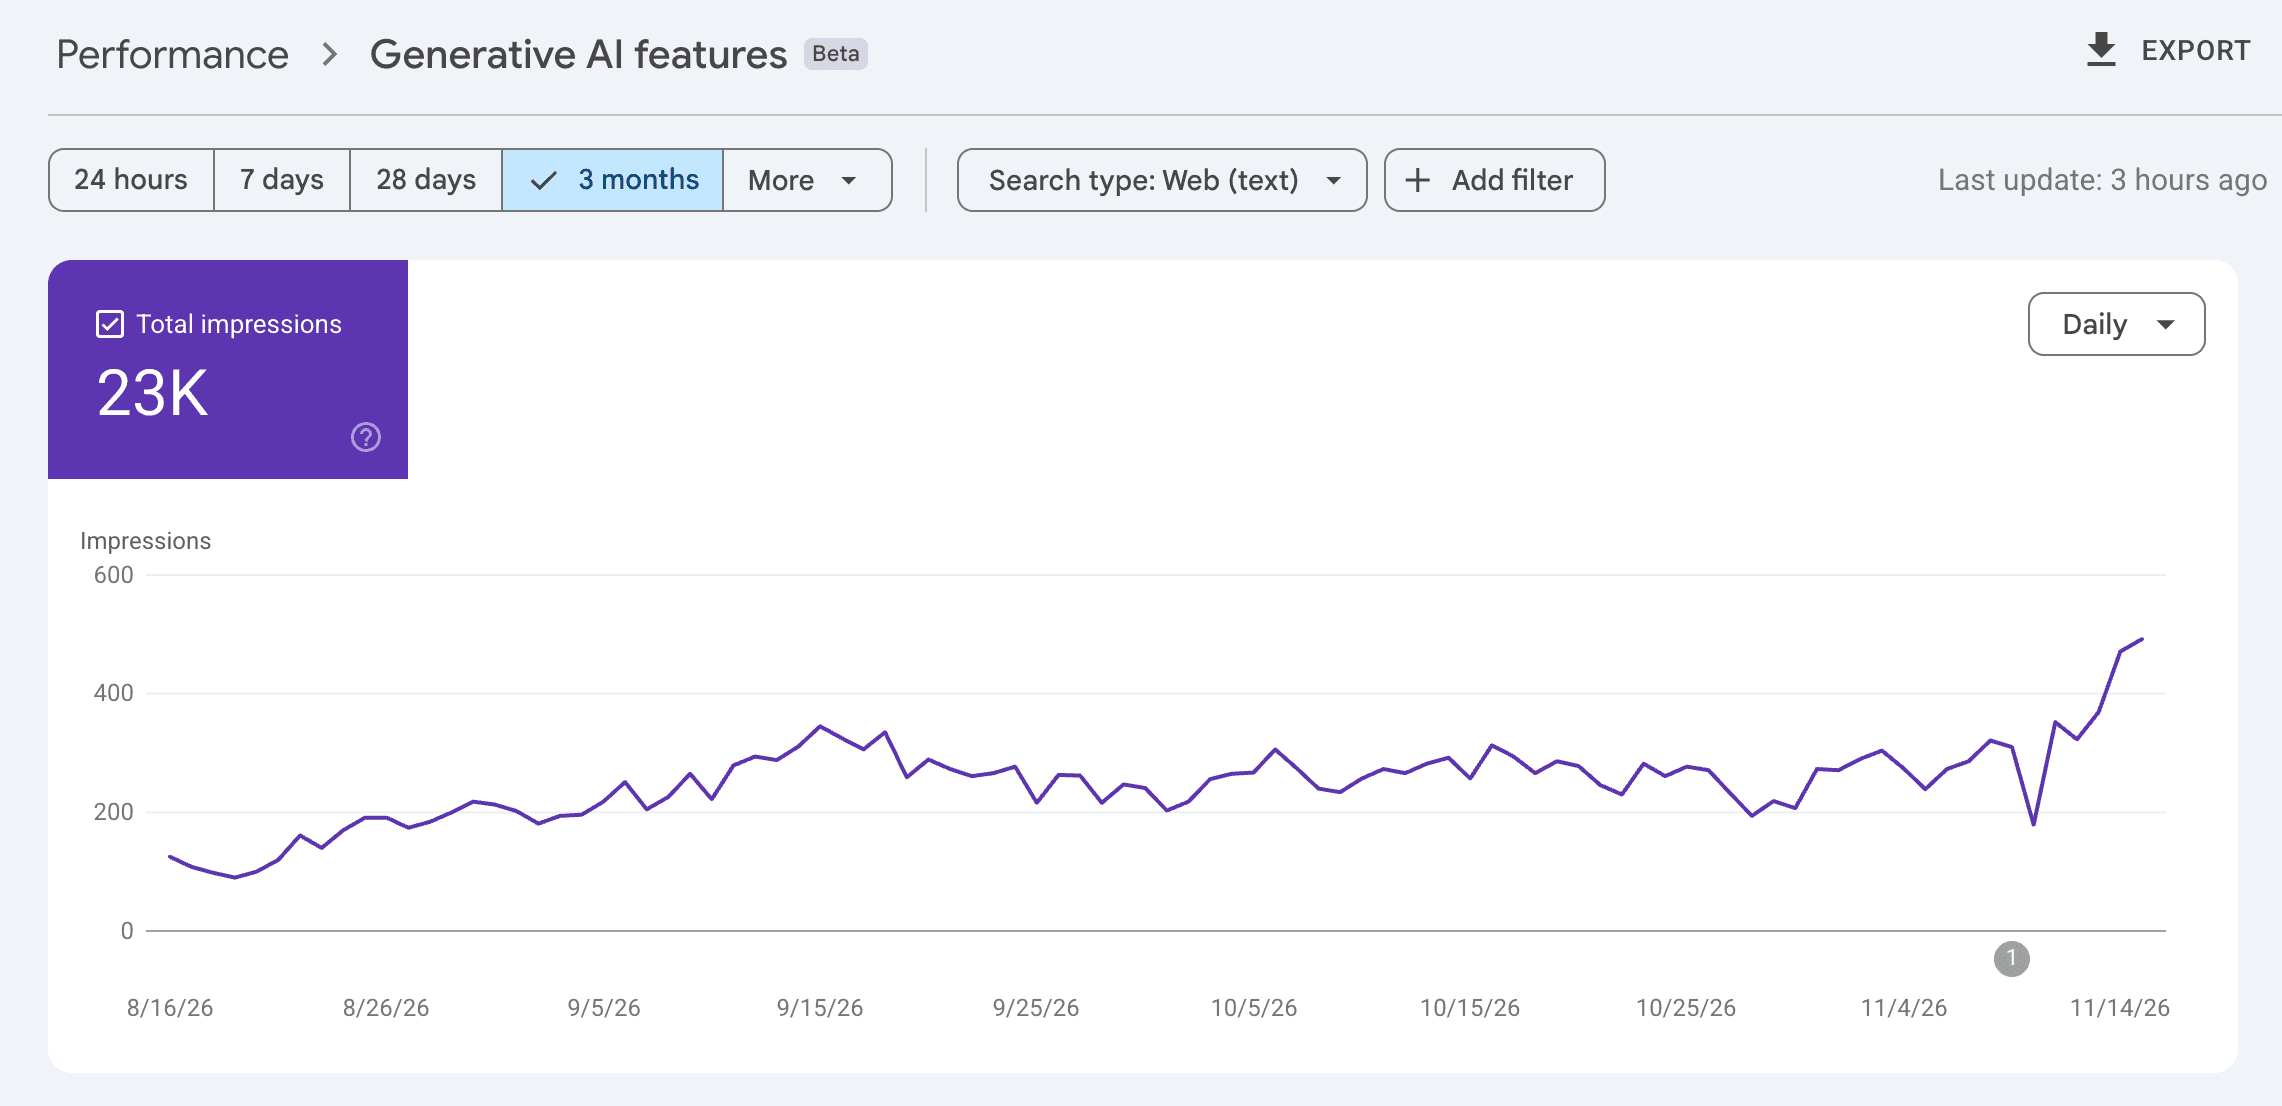
A nutrition and diet website hired me for the full engagement: audit, action plan and implementation. Over three months, its impressions in Google’s AI features went from about 120 a day to 492 on November 15. The client asked that neither the business nor the website be named, so this page leaves out anything that would identify them.
Source: the client’s Google Search Console, Generative AI features report (Beta), web search, 3-month view, read November 17, 2026.
What the Number Measures
Google Search Console’s Generative AI features report counts how often a site appeared in Google’s AI surfaces, such as AI Overviews and AI Mode. For this site the count was about 120 a day in mid-August. It more than doubled by mid-September, held between about 200 and 320 a day through October, then climbed again in November to 492 on November 15.
Nutrition is a category where people ask detailed questions and AI answers are cautious about which sources they draw on. Being one of those sources is the starting point for being trusted and chosen.
The Engagement: Audit, Plan, Implementation
Unlike an audit-only project, this one ran end to end.
What Was Worked On
Four workstreams, delivered over the same three months.
What This Does Not Show
- Clicks or revenue. The report counts impressions only, with no clicks, click-through rate or queries, so this page makes no traffic or revenue claim.
- Which surface. AI Overviews and AI Mode are reported together.
- Proof of cause. Google kept expanding its AI features during these months, which lifts many sites at once. There was no control site, so read this as a measured result, not proof that each change caused it.
Find Out Where Your Site Stands
The free check shows how ChatGPT, Gemini and Google answer the questions your customers ask. The full audit adds the reasons and a prioritized plan. Scoped to your business, confirmed on a free call.
How This Was Measured
- Client: a nutrition and diet website. Business and site names withheld at the client’s request.
- Source: Google Search Console, Performance, Generative AI features (Beta), search type Web (text), 3-month view covering August 16 to November 15, 2026, read November 17, 2026.
- Figures:23K total impressions and 492 on November 15 are the console’s own values. The mid-August level (about 120 a day) and the October range are read from the chart and are approximate.
- Impressions only. Figures as measured; they show association, not proof that any single change caused them, and are no guarantee of similar results.
More results: all case studies.